

Every business produces financial data every day. Sales numbers, expenses, invoices, inventory costs, and cash balances accumulate across departments. But raw numbers alone do not explain whether a business is actually performing well. Without proper analysis, financial data remains recorded information that is not fully understood.
This is why financial analysis is such a critical discipline in modern business. Research from PwC shows that organizations that rely heavily on data-driven analysis are three times more likely to improve their decision-making, highlighting how critical financial insight has become for businesses today.
In this blog, you will learn the fundamentals of financial analysis, including what financial analysis entails, the main types of analysis businesses use, the steps involved in conducting effective analysis, and how different stakeholders use financial insights to guide business decisions.
Financial analysis is the process of examining a company’s financial information to assess its financial stability.
For Saudi medium-sized businesses in contracting, trading, retail, manufacturing, and services, financial analysis is the process of turning financial data into clear business insight. It helps founders, CEOs, and finance heads see whether the business is truly profitable, how much pressure sits on cash flow, and whether operations are creating hidden risk.
This matters because many businesses look healthy on the surface while margins erode, costs rise, or cash gets trapped in receivables, inventory, or project delays. Financial analysis helps leadership catch those problems early, before they become bigger operational issues.
It is also a core part of planning. By reviewing trends, ratios, and financial statements, decision-makers can compare performance over time, assess stability, and make better calls on pricing, spending, growth, and capital allocation.
The core purpose of financial analysis is to give such decision-makers a reliable view of what is happening inside the business, not just what the monthly reports show. For growing companies, especially those managing multiple branches, projects, or product lines, it helps connect financial results to real operational performance.
Key objectives include:
Through these insights, financial analysis becomes a key tool for evaluating business performance and guiding strategic planning.
Financial analysis relies heavily on a company’s financial statements. These reports provide structured data about a business’s financial activities and position.
For medium-sized businesses managing inventory, projects, or multiple revenue streams, relying on a single statement can lead to misleading conclusions.
It is common, for example, to see a business reporting strong profits while cash flow remains tight, or holding large volumes of inventory that quietly tie up working capital. This is why financial statements need to be analyzed together.
Three core financial statements form the foundation of most financial analysis.
Also read: Understanding Financial Planning and Analysis Essentials

Together, these three statements give analysts a comprehensive view of a company’s financial performance, financial position, and cash stability.
Because these financial statements reveal the true condition of a business, they are examined by several groups both inside and outside the organization.
Financial analysis serves many audiences beyond the finance department. Different stakeholders study a company’s financial data to answer specific questions about performance, stability, and future potential. While managers focus on operational efficiency and profitability, investors evaluate growth and returns, and lenders assess risk and repayment capacity.
The table below outlines the main groups that depend on financial analysis and the type of insight they seek from it:
Also read: Asset Management Systems Explained: A Complete Business Guide
Understanding who relies on financial insights highlights why structured analytical methods are necessary to interpret financial data effectively.
Financial analysis is not a single method but a collection of analytical approaches used to interpret financial data from different perspectives. Each method focuses on a specific dimension of performance, such as profitability, efficiency, liquidity, valuation, or risk exposure.
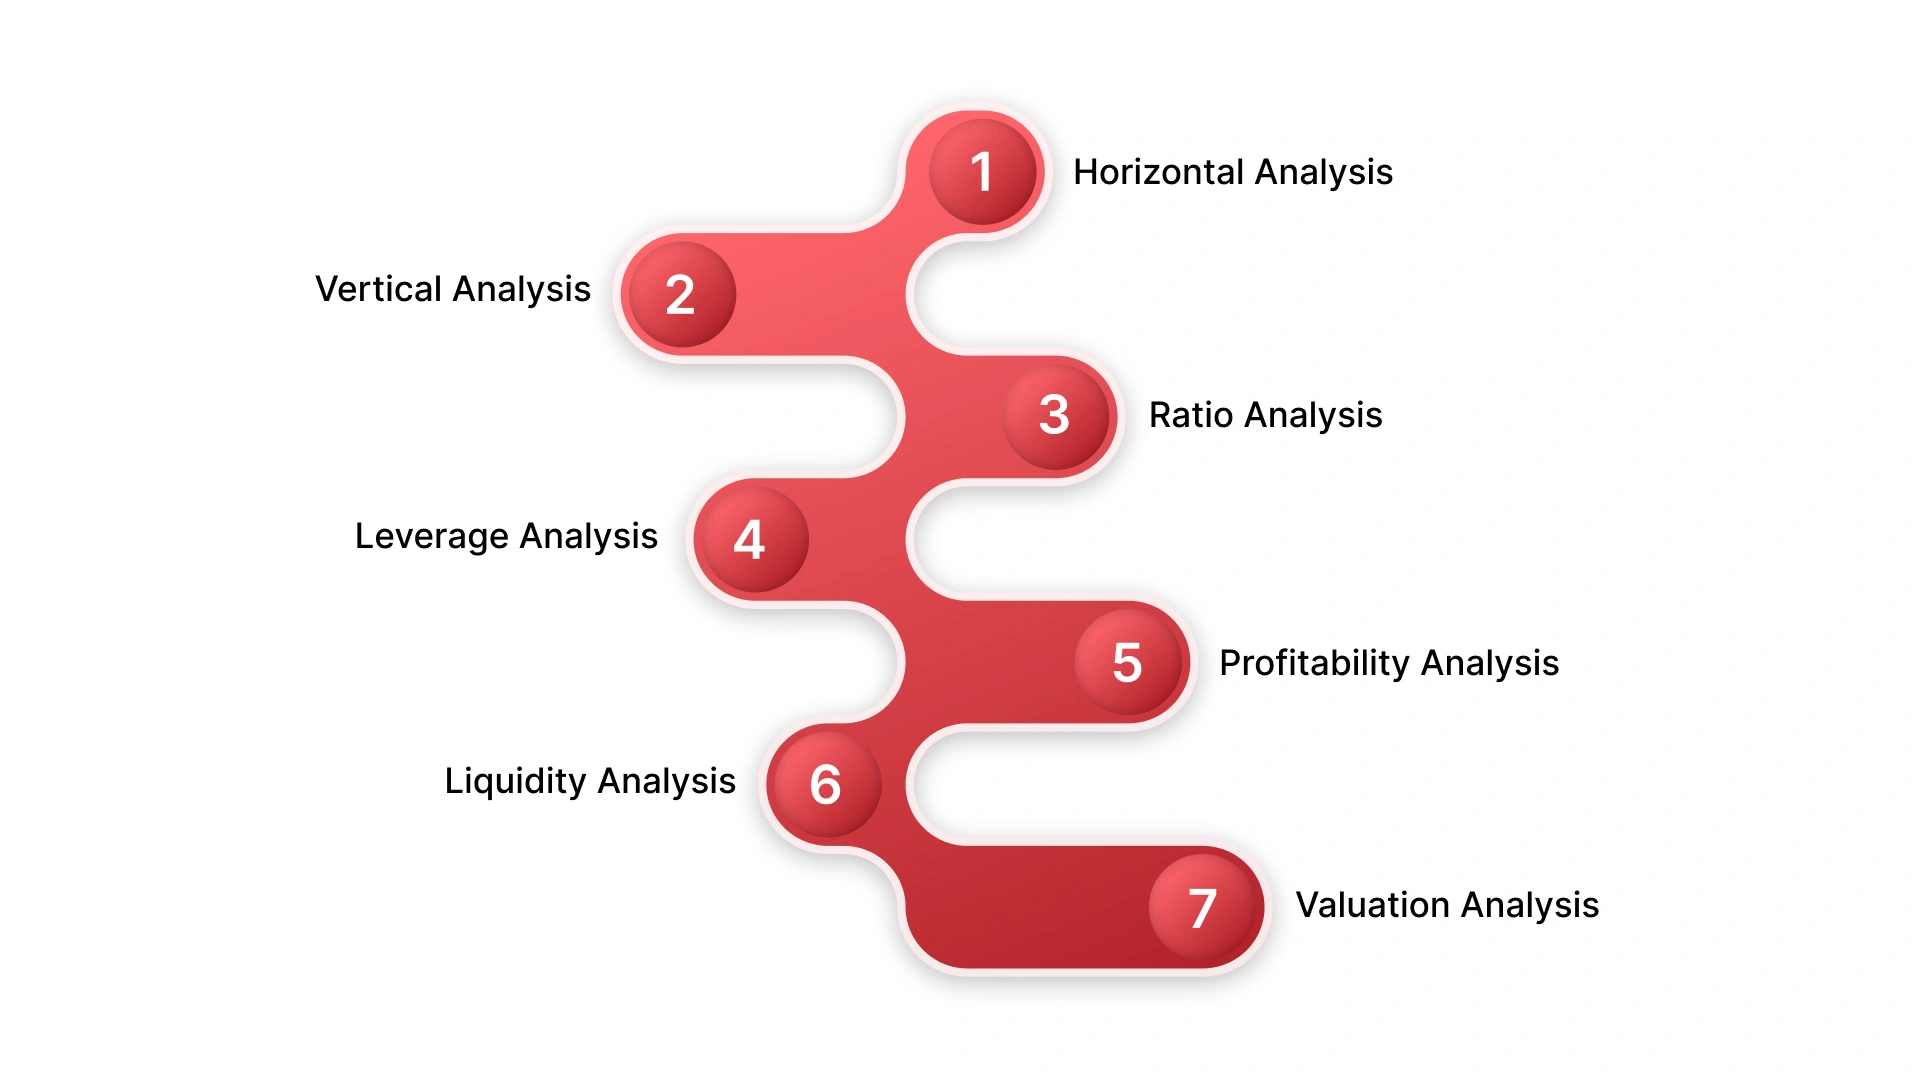
Below are several commonly used financial analysis approaches that form the foundation of most financial evaluations.
Horizontal analysis tracks performance across periods to identify trends in revenue, costs, and margins.
In practice, many businesses only review this after closing the books. By then, a steady rise in procurement costs or a drop in project margins has already compounded over weeks or months.
When applied consistently and in shorter cycles, horizontal analysis helps leadership catch negative trends early and take corrective action before profitability is affected.
Vertical analysis shows how each cost or expense contributes to revenue within a single period.
Without this, cost structures often drift quietly. Operating expenses increase, discounts widen, or project costs expand, but because everything grows together, the issue is not immediately visible.
Regular vertical analysis exposes these shifts clearly, helping finance teams control cost structures before they start eroding margins.
Ratio analysis converts financial data into indicators across liquidity, profitability, efficiency, and leverage.
In many businesses, ratios are calculated manually in spreadsheets, often inconsistently and too late. Leadership ends up reviewing outdated metrics that no longer reflect current performance.
When ratios are tracked regularly with accurate data, they become early warning signals, helping decision-makers identify financial stress, inefficiencies, or underperformance in time to act.
Leverage analysis evaluates how much the business depends on debt and how well it can manage repayment.
As businesses grow, borrowing often increases gradually across projects, inventory, or expansion. Analysts use leverage indicators such as debt-to-equity or debt-to-asset ratios to assess whether a company is relying heavily on borrowed funds. High leverage may indicate higher financial risk, while balanced leverage may support strategic growth if managed carefully.
Ongoing leverage analysis helps leadership maintain control over financial risk and avoid overextending the business.
Profitability analysis measures how effectively revenue translates into profit.
In operationally complex businesses, profitability issues rarely appear suddenly. Margins decline gradually due to pricing decisions, rising input costs, inefficient procurement, or project overruns.
When profitability is reviewed only at month-end, the damage is already done. Regular analysis helps pinpoint exactly where margins are being lost so corrective action can be taken early.
Metrics such as gross profit margin, operating margin, and return on assets help evaluate whether a company’s operations are financially sustainable. This analysis also helps identify areas where costs may be reducing profitability or where pricing strategies may need adjustment.
Liquidity analysis determines whether the business can meet its short-term obligations.
A common failure point is businesses appearing profitable while struggling to pay suppliers or manage payroll. Cash gets tied up in receivables, excess inventory, or delayed project billing.
Without frequent liquidity checks, these pressures build quietly. Strong liquidity analysis ensures that cash flow remains stable and operational disruptions are avoided.
Valuation analysis estimates the true economic value of the business.
However, when underlying financial data is delayed, inconsistent, or incomplete, valuation becomes unreliable. This can lead to poor investment decisions, inaccurate expectations, or misaligned growth strategies.
Accurate and timely financial analysis ensures that valuation reflects the real condition of the business, not outdated or incomplete data.
Valuation analysis approach considers financial metrics, projected earnings, and market conditions to determine whether a company’s value aligns with its financial performance. Valuation insights are particularly important in mergers, investment assessments, and capital allocation decisions.

Instead of relying on a single metric, analysts combine trend analysis, structural review, financial ratios, and valuation methods to develop a well-rounded view of performance and long-term sustainability.

Financial analysis becomes valuable only when it follows a structured process. Rather than reviewing financial statements casually, analysts apply a step-by-step approach to interpret financial data, identify trends, and generate insights that support business decisions. A systematic framework ensures that analysis is accurate, consistent, and aligned with the organization’s objectives.
Below are the key steps typically followed to achieve effective financial analysis.
The first step is to clearly identify the purpose of the financial analysis. Different objectives require different data and analytical methods.
For example, a business may conduct a financial analysis to:
Defining the objective ensures that the analysis focuses on the most relevant financial indicators and avoids unnecessary data evaluation.
Once the objective is established, analysts gather the necessary financial information. This typically includes key financial statements and supporting financial records.
Important sources of data include:
The accuracy and completeness of this data are critical because all subsequent analysis depends on reliable financial information.
Ratio analysis converts raw financial data into standardized indicators that help evaluate financial performance and stability.
Analysts commonly calculate ratios related to:
These ratios allow analysts to compare performance across periods, identify financial strengths and weaknesses, and benchmark the company against industry peers.
Trend analysis examines how financial performance evolves over time. Analysts review historical financial data across multiple periods to identify patterns in revenue growth, cost structures, and profitability.
Comparative analysis may also involve benchmarking the company’s financial metrics against industry standards or competitors. This helps determine whether the company’s performance aligns with market expectations.
Also read: Best Agentic ERP Solutions Providers for Scalable, Intelligent Enterprises
Cash flow analysis focuses on how effectively a business generates and manages cash. Even profitable companies can face financial pressure if cash inflows are insufficient to support operations.
Analysts review cash flow statements to evaluate:
This step helps determine whether the business can sustain operations, invest in growth, and meet its financial obligations.
After evaluating historical performance, analysts use forecasting techniques to estimate future financial outcomes. Financial forecasting models combine past financial data with expected market conditions, business initiatives, and economic trends.
Forecasting helps organizations:
This forward-looking analysis allows management to make proactive strategic decisions.
The final step is interpreting the analytical results and translating them into actionable insights. Financial analysts connect numerical results with operational realities to explain what the numbers mean for the business.
At this stage, analysts may recommend actions such as:
The goal is to ensure that financial analysis informs strategic decision-making and supports long-term business performance.
Following a structured process transforms financial analysis from a simple review of numbers into a powerful decision-making tool.
Financial analysis becomes powerful only when data is accurate, accessible, and updated in real time. When finance teams rely on disconnected spreadsheets or delayed reports, analysis becomes reactive instead of strategic. ERP transforms financial analysis from a periodic exercise into a continuous decision-making capability.
.webp)
Here’s how HAL ERP helps businesses strengthen financial analysis:
Masader, a leading engineering products supplier in Saudi Arabia, implemented HAL ERP to eliminate manual financial processes and gain clearer visibility into project costs and profitability. By integrating sales, procurement, and finance while automating invoicing and financial postings, the company streamlined operations and improved reporting accuracy. The result was 500%+ ROI, over SAR 1 million in cost savings, and real-time management of 4,500+ SKUs across 1,000+ customers.
Book a demo with HAL ERP to see how your financial data can drive faster, smarter business decisions.
Financial analysis is ultimately about turning financial data into meaningful insight. Income statements, balance sheets, and cash flow reports contain valuable information, but they only become useful when someone interprets them carefully.
For beginners, learning the fundamentals of financial analysis builds the foundation for stronger financial thinking. It helps managers evaluate performance, investors assess opportunities, and organizations identify both risks and growth potential.
If your organization wants to move beyond spreadsheets and gain real-time financial visibility, modern ERP systems can make financial analysis faster and more reliable. HAL ERP centralizes financial data, automates reporting, and provides real-time dashboards that help leaders make better decisions with confidence.
Book a demo to see how financial insights can become a daily advantage for your business.
Effective financial analysis requires a combination of accounting knowledge, analytical thinking, data interpretation skills, and familiarity with financial tools or software. Understanding financial statements, ratios, and business operations is essential for drawing meaningful conclusions from financial data.
Most businesses conduct financial analysis on a monthly or quarterly basis, although some key metrics may be monitored weekly or in real time. Regular analysis helps businesses detect financial issues early and track progress toward financial goals.
Yes. Financial analysis is valuable for businesses of all sizes. Small businesses can use it to monitor cash flow, control costs, evaluate profitability, and make informed decisions about expansion, hiring, or investments.
Financial analysis can be performed using spreadsheets, accounting software, business intelligence tools, and ERP systems that provide financial dashboards, automated reporting, and real-time performance insights.
Financial analysis helps businesses identify profitable products or services, manage costs more effectively, forecast future financial performance, and allocate resources toward opportunities that generate higher returns.